Core Web Vitals Explained: A Friendly Guide to Fixing Your Website’s Speed Issues
Let’s be honest, we’ve all clicked away from a website that took forever to load. Maybe you didn’t even wait for the whole page. You just hit the back button and went to the next search result instead.
Now flip that around. That’s exactly what’s happening to your own visitors right now, on your own blog, more often than you’d probably like to admit.
Google noticed this problem too, which is why it introduced Core Web Vitals, a set of scores that measure how a real person actually experiences your website, not just how fast it technically loads on paper. And here’s the part that should get your attention: these scores now factor into your Google rankings. So a slow site doesn’t just frustrate people; it quietly costs you traffic too.
Think of your website like a bucket you’re trying to fill with visitors from Google, social media, wherever. If that bucket has a hole in it (a slow, clunky experience), it doesn’t matter how much great content you pour in from the top; a big chunk of it leaks right back out before it ever counts. People land on your page, wait a second or two, get frustrated, and leave. Google sees that happen over and over, and slowly starts sending fewer people your way.
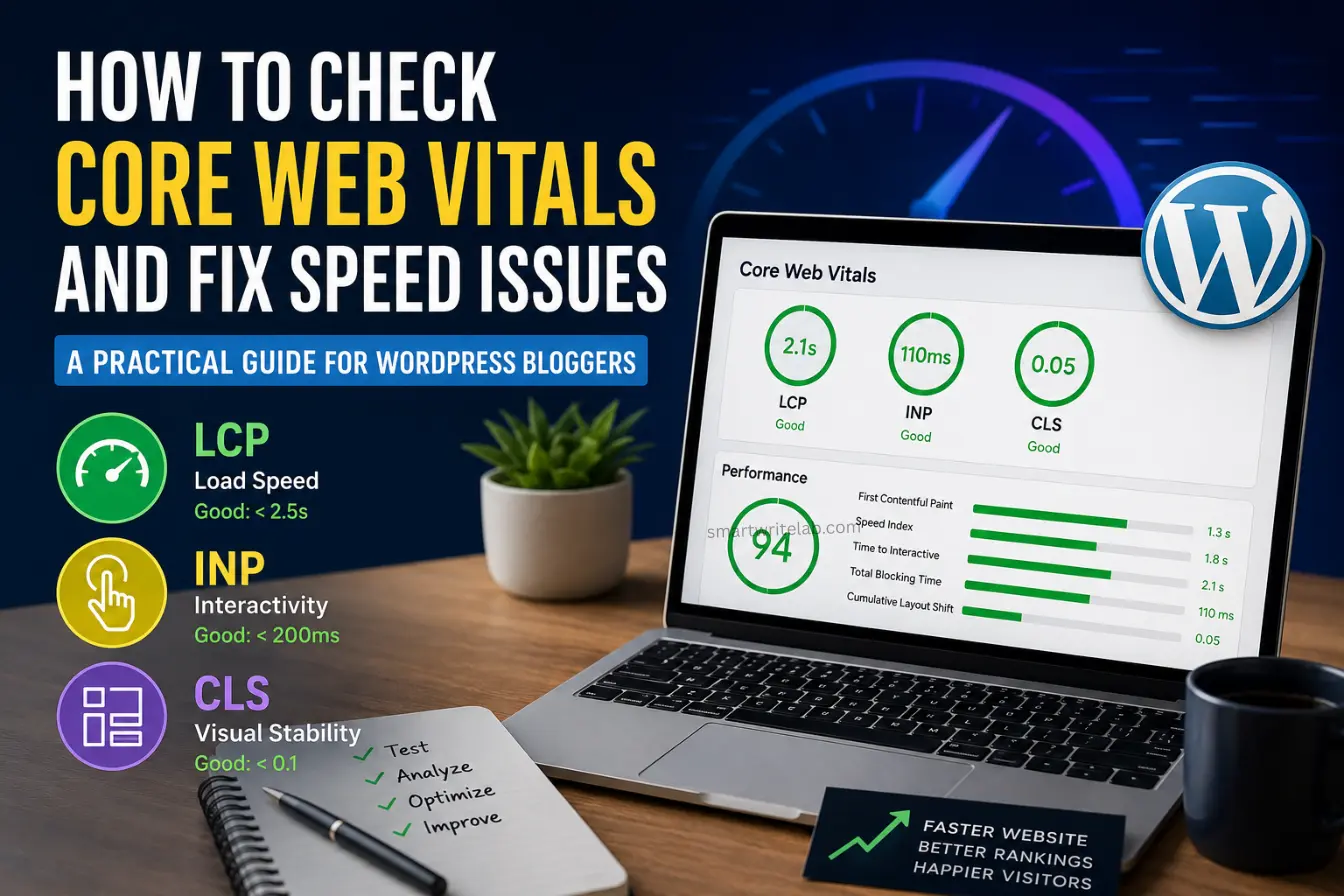
The good news? Core Web Vitals aren’t some mysterious black box. They’re just three simple things: how fast your main content appears, how quickly your site reacts when someone clicks something, and whether your page jumps around annoyingly while it’s loading. Once you understand these three things, fixing them becomes a lot less intimidating.
In this guide, we’ll break down what these metrics actually mean in plain English, show you exactly how to test your own site the right way, and walk through the most common reasons blogs and WordPress sites end up slow, plus how to fix each one.
Understanding the Core Web Vitals Big Three: LCP, FID, and CLS
These metrics sound technical, but once you hear them explained with everyday examples, they’re actually pretty intuitive.
LCP (Largest Contentful Paint) — “How long until your food actually arrives?”
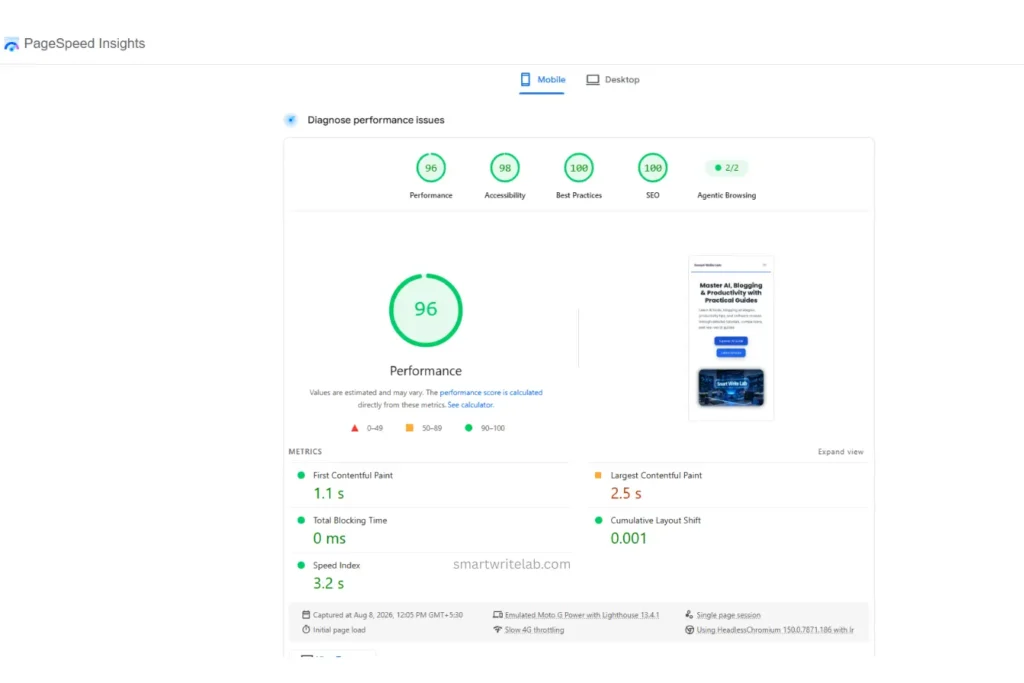
Picture yourself at a restaurant. You sit down, and eventually your food arrives. LCP is basically that wait time except online; it’s measuring how long it takes for the main part of your page (usually a big image, headline, or banner) to actually show up on screen.
It doesn’t matter if some tiny icon in the corner loaded instantly. What matters is whether the thing your visitor actually came for the content shows up quickly. Google wants this to happen within 2.5 seconds. Any longer, and people start assuming something’s broken, then they leave.
FID / INP (Interactivity) — “Is anyone actually listening?”
Imagine you wave down a waiter for more water, and they just.. stare at you for five seconds before responding. Frustrating, right? That’s essentially what a slow, unresponsive website feels like when someone clicks a button or taps a menu, and nothing happens right away.
This used to be measured by something called First Input Delay (FID), but Google has since moved to a more complete metric called Interactivity to Next Paint (INP), which checks responsiveness throughout your entire visit, not just that first click. Either way, the idea is simple: when someone interacts with your site, it should respond almost instantly. Ideally, under 200 milliseconds.
CLS (Cumulative Layout Shift) — “Why does the page keep jumping around?”
This one drives people crazy, and you’ve almost certainly experienced it yourself. You start reading an article, and suddenly an ad pops in above the text and shoves everything downward right as you were about to tap a link. Now you’ve accidentally clicked the wrong thing entirely.
That annoying jump is called Cumulative Layout Shift, and it usually happens because images or ads load in without the browser first reserving space for them. Google wants this score to stay under 0.1; in plain terms, your page should feel stable, not wobbly.
Read More: Why New Blogs Don’t Get Traffic (Real Reasons New Bloggers Miss)
How to Run an Accurate Core Web Vitals Test
Before you can fix anything, you need to know exactly where things stand. And this is where a lot of people get tripped up, because there are two popular testing tools, and they actually measure different things.
Google PageSpeed Insights (PSI) — What Your Real Visitors Are Experiencing
PageSpeed Insights pulls data from real Chrome users who’ve actually visited your site over the past 28 days (this data source is called CrUX, if you ever see that term floating around). This is called “field data,” and it’s the number Google genuinely uses when deciding how to rank you.
Here’s how to check it:
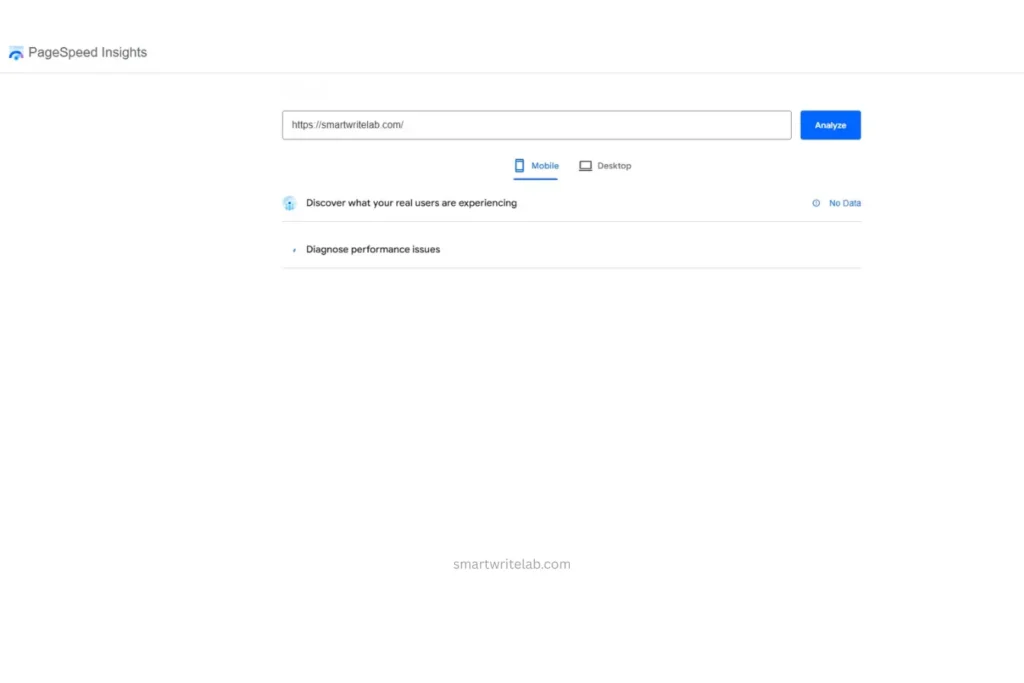
- Head over to pagespeed.web.dev
- Paste in your URL
- Scroll to the section that says “Discover what your real users are experiencing“
One thing to keep in mind: if your blog doesn’t get a ton of traffic yet, PSI might not have enough real user data to show you field results. That’s completely normal for newer sites, and it just means the tool will lean on lab data instead.
Lighthouse — A Simulated Test Under Controlled Conditions
Lighthouse (built right into Chrome’s DevTools, and also shown lower down on your PSI report) runs a one-off test under fixed, simulated conditions. This is your “lab data.”
Here’s the difference that actually matters: lab data is fantastic for debugging, because it’ll point you straight to the exact image or script causing trouble. But it doesn’t capture the messy reality of real people on real devices with real (often spotty) internet connections. Field data is less tidy, but it’s the truth Google actually cares about.
A simple way to use both together:
- Start with PSI’s field data to see if your real visitors are actually struggling.
- Switch to Lighthouse to pinpoint exactly what’s causing the slowdown.
- Fix it, then check back in a few weeks to confirm the improvement shows up in your real-world numbers too.
Read More: How to Optimize AI Content for Google (Complete SEO Guide)
4 Common Culprits Slowing Down Your Blog (And How to Fix Them)
So you’ve run your tests and, sure enough, your scores aren’t great. Don’t panic; most speed problems on blogs come down to just a handful of repeat offenders. Let’s go through them one by one.
1. Huge, Unoptimized Images
This is, without question, the most common reason blogs score poorly on LCP. Think about it: a photo straight off a phone or DSLR can easily be 5-8MB, completely uncompressed. And more often than not, that giant image is exactly the “hero image” at the top of your post, meaning it’s the very thing Google is measuring your load time against.
Here’s how to fix it:
- Compress your images before uploading them, ideally converting to WebP or AVIF formats; they look just as good as JPEG but are noticeably smaller in file size.
- Let a plugin do the heavy lifting for you. ShortPixel, Imagify, and Smush all auto-compress images the moment you upload them.
- Turn on lazy loading for anything below the fold (WordPress has had this built in since version 5.5), so images further down the page don’t compete for bandwidth with your main content.
- Always add width and height values to your images. This tiny step tells the browser to reserve space for the image ahead of time, which stops your page from jumping around as things load.
2. Too Many Plugins (Or Just Poorly Built Ones)
Every single plugin you install adds its own bit of CSS, JavaScript, and sometimes extra database queries. If you’re running 25+ plugins, especially a stack of overlapping SEO tools, page builders, and “does everything” bloatware, your site is essentially fighting itself every time someone loads a page.
Here’s how to fix it:
- Install Query Monitor to see, in plain numbers, which plugins are slowing things down the most.
- Be honest with yourself about what you actually use, and delete the rest. Simply deactivating isn’t quite enough; unused plugins still sit there bloating your files and database.
- Where you can, swap several single-purpose plugins for one well-built one that covers the same ground; just don’t fall into the trap of installing a giant “all-in-one” suite packed with features you’ll never touch.
3. Cheap or Poorly Set Up Hosting
Here’s the frustrating truth: you could optimize every image and every line of code perfectly, and it still won’t matter much if your server itself takes forever just to respond in the first place. That initial response time is called Time to First Byte (TTFB), and if it’s slow, everything else gets delayed right out of the gate.
Here’s how to fix it:
- Steer clear of the cheapest shared hosting plans, where you’re essentially sharing resources with hundreds of other websites on the same server.
- Consider managed WordPress hosting (Hostinger, Kinsta, WP Engine, and SiteGround are popular choices), or a modern host built on LiteSpeed or NGINX with caching baked in at the server level.
- Add a CDN, like Cloudflare, so your images and files get served from a location physically closer to whoever’s visiting your site — instead of always traveling from one single server.
4. Clunky CSS and JavaScript That’s Blocking Your Page
By default, a browser will pause everything and refuse to show your page until it’s downloaded and processed every CSS and JavaScript file listed at the top of your site. If your theme or plugins are loading a dozen different scripts before anything even appears on screen, your visitor is just staring at a blank white page the whole time.
Here’s how to fix it:
- Use an optimization plugin like WP Rocket, Perfmatters, or Autoptimize to combine, shrink, and delay non-essential CSS and JavaScript files.
- Set non-urgent scripts (chat widgets, tracking pixels, social share buttons) to load with “defer” or “async“, so they don’t hold up the rest of the page.
- Track down and remove unused CSS; a surprising number of themes load an entire design framework when the page only actually uses a small fraction of it.
- Be ruthless about cutting third-party scripts you don’t truly need. Every extra tracking pixel or embedded widget adds its own loading time.
Read More: 7 Best Free Blogging Platforms to Make Money in 2026: I Actually Tested
Frequently Asked Questions (FAQs)
Conclusion
Here’s the thing about Core Web Vitals: you never really “finish” optimizing them. Every time you upload a new image, install a plugin, or update your theme, you’re introducing a small chance of slowing things back down again. Google keeps refining its standards, people’s expectations keep climbing, and what felt “fast enough” a few years ago would feel painfully slow today.
So instead of treating this like a one-time project you check off a list, think of it the same way you’d think about your content strategy or SEO something you keep an eye on regularly. Run a quick speed check once a month, glance at your Search Console data every so often, and jump on any issues before they pile up. The blogs that stay genuinely fast aren’t the ones that got lucky; they’re the ones that keep checking in.

Ravi Shankar Naval is the founder of Smart Write Lab, where he publishes practical content about AI tools, blogging, SEO, and digital growth. His goal is to help beginners and creators learn modern online strategies through simple, helpful, and easy-to-understand tutorials.